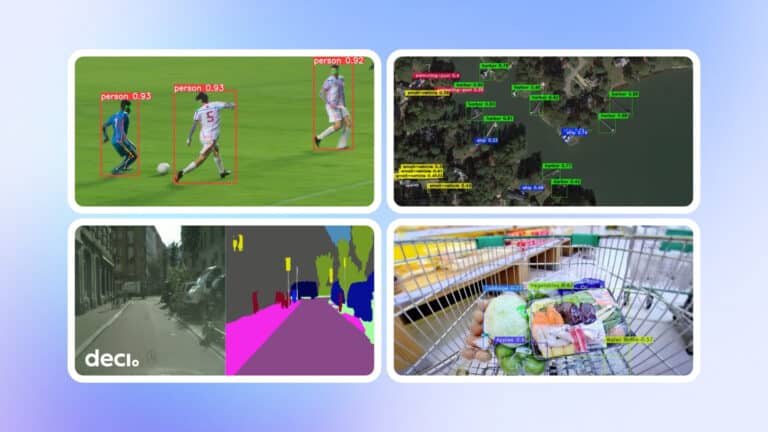
Today, we’re thrilled to announce the launch of DataGradients, our open-source tool designed specifically for profiling computer vision datasets and distilling critical insights. These insights pave the way for superior model design and quicker training.
DataGradients is an invaluable tool for data scientists. With just a single line of code, it provides a statistical analysis of your dataset, focusing on common data problems, pitfalls, and general characteristics that may affect the model design or the training process.
DataGradients’ Main Benefits:
In-depth Analysis: DataGradients offers a comprehensive examination of your dataset, delivering statistics, visualizations, and essential metadata in an easily accessible format. This lets you recognize your dataset’s unique characteristics, strengths, and potential weaknesses.
Actionable Insights: The tool’s robust reporting helps illuminate potential issues with your dataset that could negatively impact your model’s performance. With these insights, you can take action to improve your training processes and dataset quality.
Efficient Model Development: By understanding your dataset’s characteristics upfront, you can streamline the model development process. This leads to more effective training and, ultimately, better model performance and accuracy.
Data Privacy: Crucially, DataGradients is designed with data privacy in mind. Since it operates on-premises, it allows you to maintain complete control over your data. There’s no need to upload sensitive datasets to third-party servers, ensuring your data remains secure and private throughout the analysis process.
Keep reading as we take a deeper dive into how this powerful tool can revolutionize your approach to data analysis and model building.
The Importance of Dataset Profiling
In the realm of computer vision, the power of your model is inherently linked to the quality of the data used for training. Identifying issues in your dataset is paramount; it not only steers clear of training roadblocks but also sheds light on any underperformance of your model. Perhaps what doesn’t get enough airtime is how your model quality is also tied to the fit between your data and model design. The peculiarities of your dataset characteristics —the prevalence of many tiny objects or a handful of large ones—can influence certain design decisions, like whether to retain the less efficient initial skip connections in a model. A good read on your dataset’s attributes can help you nail decisions like the appropriate model choice, the best loss function, and the ideal optimization method.
Data Visualization Libraries and Generic EDA Tools Fall Short
Most dataset profiling tools are data visualization libraries or general-purpose statistical analysis tools that work well for tabular data but fall short when applied to image data.
Image data has distinct features that set it apart from tabular data. Images are collections of pixels organized in multiple color channels. This makes it challenging for generic EDA tools to give you meaningful insight.
But your concerns go beyond just pixels.
In deep learning, you have labels and annotations. Masks and bounding boxes come in many formats – labels first or last, xyxy, xywh, cxcywh. Images can exhibit various color schemes – bright, dark, gray, or colorful. Objects in images can take various shapes – wide, narrow, small, or large. Objects can be convex or concave, and bounding boxes may intersect. Classes can be imbalanced, distributed evenly in images, or not.
Generic EDA tools and data visualization libraries can’t take image data and quickly summarize it with simple statistical plots like histograms or scatter plots.
Fortunately, there is a tool that can – DataGradients.
Developed by the deep learning experts at Deci, DataGradients is a free, open-source tool designed to simplify the lives of computer vision practitioners. It lets you glean significant insights from your datasets, enabling you to develop superior models faster.
Next, we’ll walk through the functionalities of DataGradients and show you how it can power up your deep learning model development process. If you’re ready to learn more about your data and take your computer vision model building to the next level, keep reading. We believe you’re in for a treat.
How DataGradients’ Insights Can Streamline Your Model Design and Training Process
We’ll begin by exploring the types of insights DataGradients delivers when it profiles your dataset. We’ll then describe how these insights can help identify problems with your dataset and how they can inform your model design choices.
DataGradients’ Insights
DataGradients profiles your computer vision dataset and delivers insights about:
- The nature of the objects depicted (convexity, depth mask, center of mass, fine details)
- The size distribution of the objects (segments or bounding boxes)
- Class distribution
- Image brightness and color distribution
- Image aspect ratios and resolution
Using DataGradients’ Insights to Identify Problems with Your Dataset
These insights can help identify the following problems with your data:
1. Corrupted Data
Extreme brightness values – unusual brightness levels might indicate image corruption
Anomolous channel statistics – unexpected per-channel mean and standard deviation can flag corrupted data
2. Labeling Errors
Unusual object areas – small or large object areas, contrary to expectations for a particular class, might suggest labeling errors. For instance, if some cats are much bigger on average than cars.
Object location anomalies – if objects of a particular class are consistently found in unlikely locations, this might indicate a labeling mistake. For instance, if the sky is usually in the lower part of the image.
3. Faulty Augmentations
Unstable objects post-augmentation – if augmented data consistently results in objects that have a distribution too far from the original data, this might indicate a bad augmentation. It is good to change the distribution for robustness slightly, but only to a certain point.
4. Disparities Between the Training Set and the Validation Set
Class distribution disparities – a common mistake is having a class that is underrepresented in the training set but not in the test set, severely limiting the model’s ability to learn that class.
Image brightness and color distribution may indicate that the training and test datasets were captured under different conditions. For instance, if most images in the training set were taken in bright daylight, while most images in the test set were captured in low light conditions, it could result in poor performance on the validation set.
Using DataGradients’ Insights for Better Model Design
The insights that DataGradients delivers can also inform your model design choices.
1. The Impact of Object Size Distribution on Model Design
When training a model, it is essential to determine whether your data consists of numerous small objects or just a few large objects in each image. This information can impact your skip connections, downscaling, receptive field, and model depth decisions. A common pitfall is discarding the initial non-efficient skip connection in a model when the data necessitates the high frequencies associated with these connections.
2. The Impact of Object Characteristics on Model Design
Consider factors such as convexity, depth mask, and fine details of the segments in your data. Once again, a typical mistake is eliminating a model’s non-efficient initial skip connections, particularly when your data includes segments with intricate details that require high-frequency and high-resolution information.
Let’s illustrate how these insights can inform your choices in building your model with some examples.
Consider the two images displayed below: Image A and Image B.
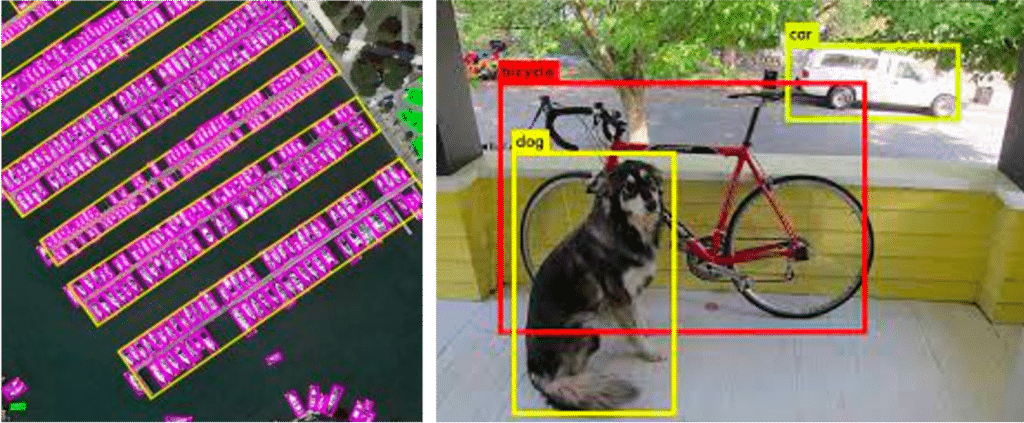
The design decisions for your model will vary significantly based on the image type you’re dealing with. For instance, Image A is filled with many small objects, while Image B contains only a few large ones. Datasets exhibiting these diverse characteristics demand different approaches across various factors. They necessitate distinct training hyperparameters, loss functions, data augmentation strategies, and other considerations. Understanding these nuances can guide you toward optimizing your model design and training process.
Now consider another group of images:
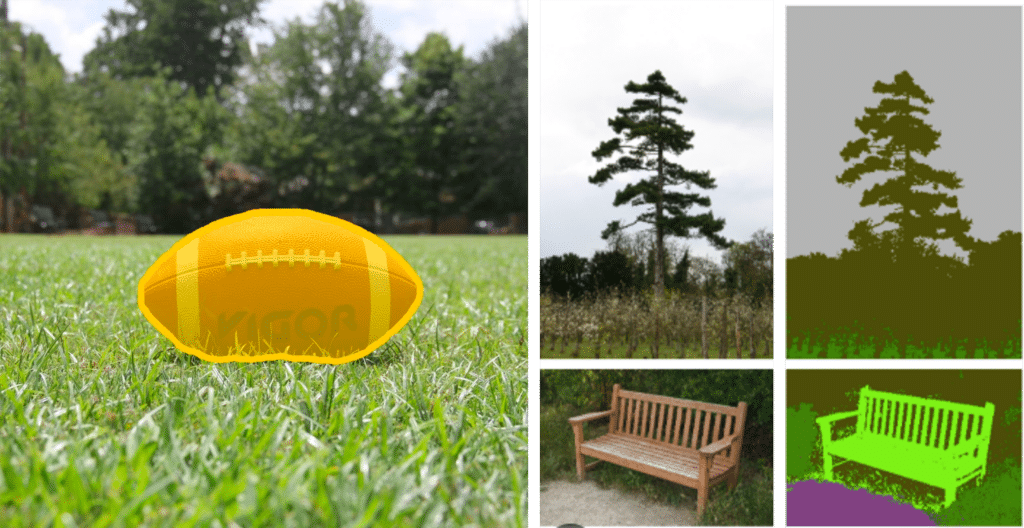
The task of designing semantic segmentation models varies greatly when comparing a simple convex object, like a football, to more intricate objects with fine details, like a tree or a bench. These objects’ complexity and specific characteristics introduce unique challenges and considerations in the model design process.
How to Use DataGradients
Leveraging DataGradients to profile your computer vision datasets and improve your object detection and semantic segmentation model training and design is easy.
Installation
To get started with DataGradients, simply pip-install the package with the following:
pip install data-gradients.
Running DataGradients
To run DataGradients on an object detection dataset, use the following code:
da = DetectionAnalysisManager(
report_title="Testing Data-Gradients Detection",
train_data=train_set,
val_data=val_set,
class_names=train_set.class_names,
)
da.run()
To run it on a semantic segmentation dataset, use this code:
da = SegmentationAnalysisManager(
report_title="Testing Data-Gradients",
train_data=train_set,
val_data=val_set,
class_names=train_set.class_names,
)
da.run()
By default, DataGradients analyzes all features of your dataset. However, you can choose the features you want to focus on. The features are all defined in the configuration file, which you can change by inserting a comment, excluding certain features without digging into the Python code.
For object detection:
report_sections:
- name: Image Features
  features:
    - SummaryStats
    - ImagesResolution
    - ImageColorDistribution
    - ImagesAverageBrightness
- name: Object Detection Features
  features:
    - DetectionSampleVisualization:
        n_rows: 3
        n_cols: 4
        stack_splits_vertically: True
    - DetectionClassHeatmap:
        n_rows: 6
        n_cols: 2
        heatmap_shape: [200, 200]
    - DetectionBoundingBoxArea:
        topk: 30
        prioritization_mode: train_val_diff
    - DetectionBoundingBoxPerImageCount
    - DetectionBoundingBoxSize
    - DetectionClassFrequency:
        topk: 30
        prioritization_mode: train_val_diff
    - DetectionClassesPerImageCount:
        topk: 30
        prioritization_mode: train_val_diff
    - DetectionBoundingBoxIoU:
        num_bins: 10
        class_agnostic: true
For semantic segmentation:
report_sections:
- name: Image Features
  features:
    - SummaryStats
    - ImagesResolution
    - ImageColorDistribution
    - ImagesAverageBrightness
- name: Segmentation Features
  features:
    - SegmentationSampleVisualization:
        n_rows: 3
        n_cols: 3
        stack_splits_vertically: True
        stack_mask_vertically: True
    - SegmentationClassHeatmap:
        n_rows: 6
        n_cols: 2
        heatmap_shape: [200, 200]
    - SegmentationClassFrequency:
        topk: 30
        prioritization_mode: train_val_diff
    - SegmentationClassesPerImageCount:
        topk: 30
        prioritization_mode: train_val_diff
    - SegmentationComponentsPerImageCount
    - SegmentationBoundingBoxResolution
    - SegmentationBoundingBoxArea:
        topk: 30
        prioritization_mode: train_val_diff
    - SegmentationComponentsConvexity
    - SegmentationComponentsErosion
DataGradients supports a variety of datasets. It has a dataset adapter __getitem__() that takes as input any one of the following dataset types, including:
Numpy.ndarray
PIL.Image
Python dictionary (Mapping)
Python list / tuple (Sequential)
And outputs a tuple (images, labels). If the dataset you enter is a dictionary, you’ll be asked to indicate the image and the label.
Here’s an example of full flow of questions:
------------------------------------------------------------------------
Which tensor represents your Image(s) ?
------------------------------------------------------------------------
This is how your data is structured:
data = {
    "image": "ndarray",
    "annotation": {
        "bbox": "ndarray",
        "image_id": "int",
        "segmentation": "ndarray"
    }
}
Options:
[0] | data.image: ndarray
[1] | data.annotation.bbox: ndarray
[2] | data.annotation.image_id: int
[3] | data.annotation.segmentation: ndarray
Your selection (Enter the corresponding number) >>> 0
Great! You chose: data.image: ndarray
------------------------------------------------------------------------
Which tensor represents your Label(s) ?
------------------------------------------------------------------------
This is how your data is structured:
data = {
    "image": "ndarray",
    "annotation": {
        "bbox": "ndarray",
        "image_id": "int",
        "segmentation": "ndarray"
    }
}
Options:
[0] | data.image: ndarray
[1] | data.annotation.bbox: ndarray
[2] | data.annotation.image_id: int
[3] | data.annotation.segmentation: ndarray
Your selection (Enter the corresponding number) >>> 1
Great! You chose: data.annotation.bbox: ndarray
------------------------------------------------------------------------
Which comes first in your annotations, the class id or the bounding box?
------------------------------------------------------------------------
Here's a sample of how your labels look like:
Each line corresponds to a bounding box.
tensor([[  6., 156.,  97., 351., 270.]], dtype=torch.float64)
Options:
[0] | Label comes first (e.g. [class_id, x1, y1, x2, y2])
[1] | Bounding box comes first (e.g. [x1, y1, x2, y2, class_id])
Your selection (Enter the corresponding number) >>> 0
Great! You chose: Label comes first (e.g. [class_id, x1, y1, x2, y2])
------------------------------------------------------------------------
What is the bounding box format?
------------------------------------------------------------------------
Here's a sample of how your labels look like:
Each line corresponds to a bounding box.
tensor([[  6., 156.,  97., 351., 270.]], dtype=torch.float64)
Options:
[0] | xyxy: x-left, y-top, x-right, y-bottom		(Pascal-VOC format)
[1] | xywh: x-left, y-top, width, height			(COCO format)
[2] | cxcywh: x-center, y-center, width, height		(YOLO format)
Your selection (Enter the corresponding number) >>> 2
Great! You chose: cxcywh: x-center, y-center, width, height		(YOLO format)
If you’re using DataGradients to analyze a dataset for semantic segmentation, DataGradients will automatically convert your images into (3, H, W) and your labels into (CHW). However, if you’re using it for object detection, some formatting actions will be required:
Label first vs Label last
Bbox format (xyxy, xywh, cxcywh)
Other actions will be automatic:
- Images will be automatically formatted into (3, H, W)
- Label will be normalized if necessary
- Labels will be automatically formatted into (label, x, y, x, y), not normalized
The duration it takes for DataGradients to run varies depending on the size of your dataset. You can expect a completion time of between 1 to 10 minutes for smaller datasets. However, the process may take several hours for larger, more extensive datasets. DataGradients offers a feature where you can limit the number of samples used, allowing you to manage the running time as needed.
DataGradients’ Output
After DataGradients has completed its analysis, which should range anywhere from x to y, depending on the size and nature of your dataset, it outputs two files:
- A PDF containing stats, graphs, and visualizations for the dataset features you selected to be analyzed
- Json file containing all raw metadata extracted but none of the original data in your dataset
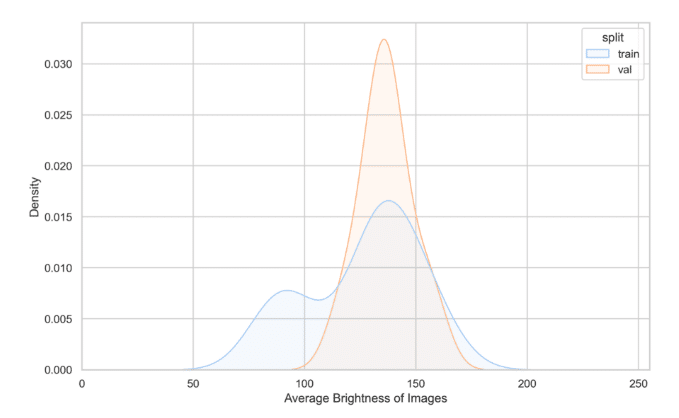
Here is an example of a graph taken from a DataGradients report, which displays the brightness distribution of the training and validation sets.
Are you interested in delving deeper into DataGradients’ reports? We invite you to examine the reports created by DataGradients for two widely-used datasets: Coco for object detection and CityScapes for semantic segmentation.
Enhance Your DataGradients Experience: Our Specialized Course on Computer Vision Dataset Profiling
If you want to know how to solve the data issues identified in the DataGradients report and use your dataset’s characteristics to improve your model training and design, check out our course on profiling computer vision datasets. This comprehensive course covers image data profiling in detail and shows practical ways to use dataset profiling to enhance your work with computer vision models.
Conclusion
To wrap up, we’ve journeyed through the essential features and benefits of DataGradients. We’ve learned how crucial dataset profiling is in building robust computer vision models and how DataGradients can facilitate this process. This tool not only helps identify potential issues within your datasets but also guides efficient model design and training.
We invite you to explore this tool and experience firsthand the transformative potential it holds for your computer vision tasks. Happy modeling!