Deep learning model development in 2023 is still a fairly unstructured, messy process. Many of the steps along the way can be unpredictable and tough to estimate in terms of cost, time, and impact on the final product’s performance. This very often leads to dead-end results that can’t be deployed to production, forcing engineers to return to the drawing board and repeat the cycle.
Deci’s mission is to help AI developers break these barriers and unlock the true potential of deep learning. This is why we’re excited to launch our new experiment management capabilities and integration with the TensorBoard library. This feature further allows us to empower teams with the tools they need to go to production faster.
Production-Aware Development – The New Way to Go from Lab to Production
At Deci, we believe that the fastest and optimal way to go from lab to production is by adopting a production-aware approach to model development.
In many AI teams, model development and model optimization and deployment are done in silos and by separate teams, oftentimes with different goals in mind. The data science team is designing the models and is focused on getting the optimal accuracy while the ML engineering team is tasked with taking the trained model to production.
Running successful inference at scale requires meeting various performance criteria such as latency, throughput, and model size, among others. Optimizing inference performance after a model has already been developed is a very cumbersome and costly process which often leads to project delays and failures. Accounting for the inference environment and production constraints early in the development lifecycle can significantly reduce the time and cost of fixing potential obstacles to trying to deploy models.
Break the Silos and Easily Collaborate Across the Dev Lifecycle
Deci’s deep learning development platform equips teams with the tools and visibility they need in order to adopt a production-aware model development approach and easily collaborate from the get go. Precious time previously wasted on endless trial and error iterations, and back and forth between model design and model optimization is eliminated and deployment success rates are dramatically increased.
Here’s an overview of some of the features that empower teams to collaborate more effectively and simplify the development process:
Model Selection and Evaluation
When selecting a model, before training it, you can upload it to the platform and easily benchmark different architectures and understand their speed and ability to compile to the target deployment framework and hardware. This helps you save time and costs by ensuring that you are training the optimal architecture from the get go and not spending time and money on an architecture that might meet the accuracy but will be too large or too slow.
New Training Visibility and Visualization
One of the pain points associated with training DL models is the lack of visibility into the training process. Visualization should be a frictionless endeavor. Although the tools are available and familiar to data scientists, especially the TensorBoard library, most developers end up battling with the installation, setup, and compatibility of different visualization frameworks.
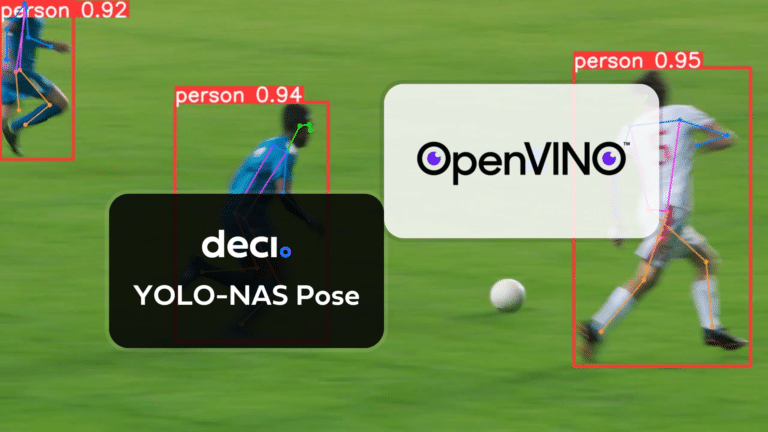
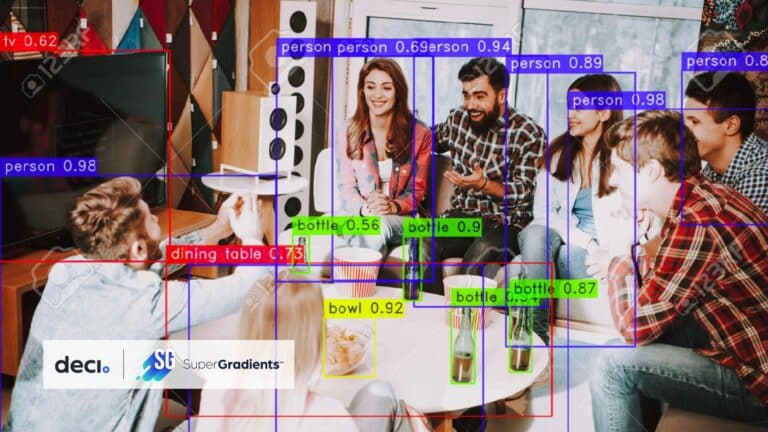
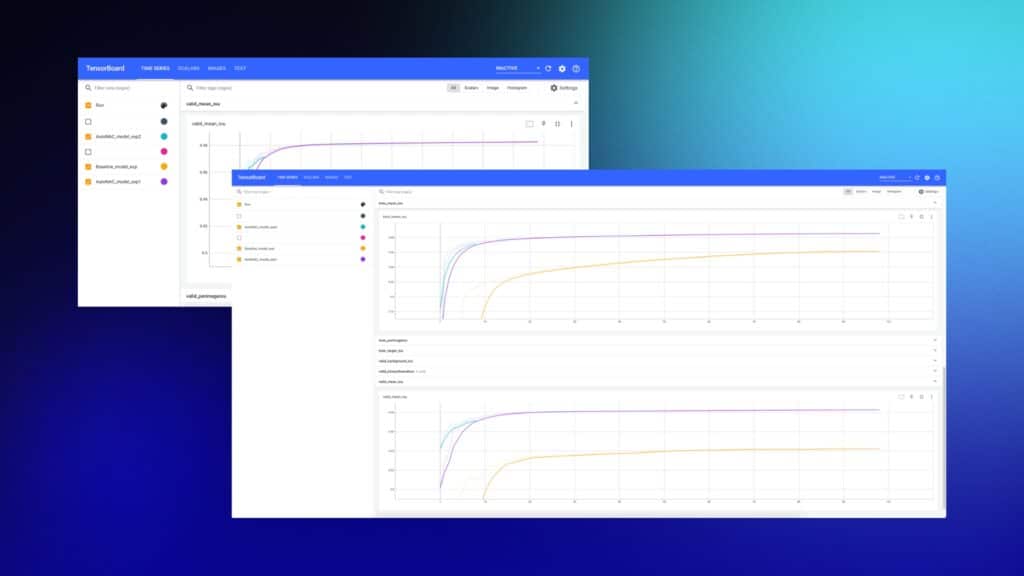
The TensorBoard library, created by Google, provides a web-based interface for visualizing and analyzing deep learning models. At Deci, we believe visualization should be an integral part of the training process. That’s why we integrated the TensorBoard library with the SuperGradients training library. SuperGradients, developed by Deci experts for the AI community, is a free, open-source library for training PyTorch-based computer vision models.
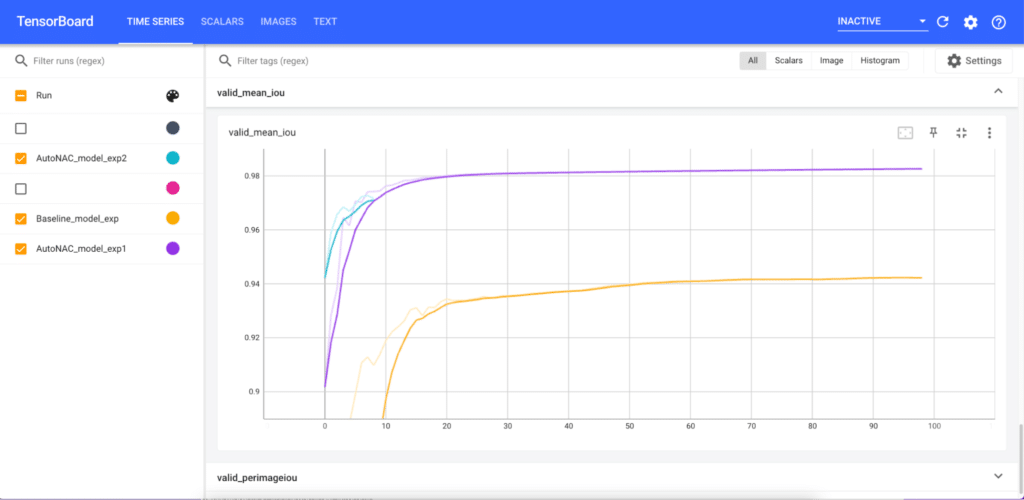
When training your models with SuperGradients and the Deci platform, the training logs are automatically uploaded to the platform for every experiment – which can be resumed or overwritten out of order, at any time. Now, with the added visualization features from TensorBoard, you can visualize and track every single experiment. Beyond the tracking, you can also compare the training on different architecture candidates and see insights regarding its future expected performance – all as part of the training process.
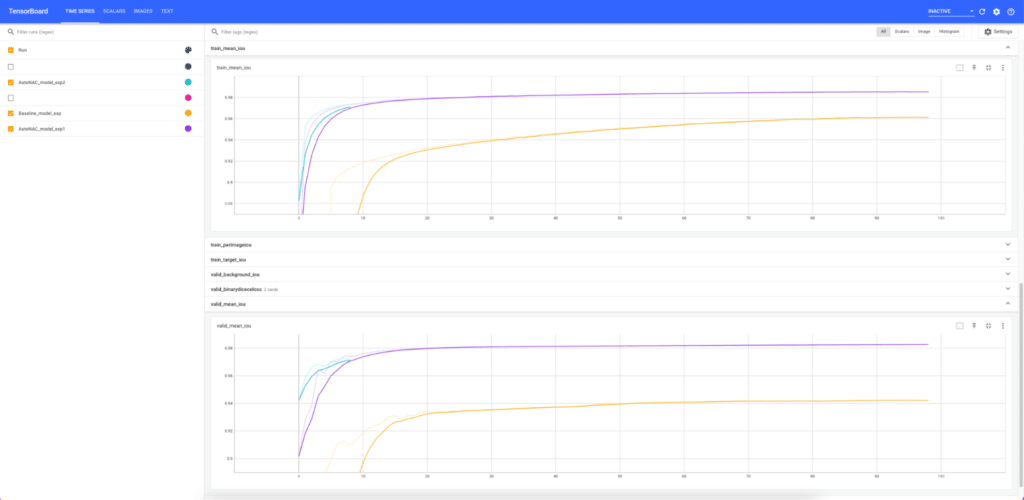
Because the TensorBoard interface is modular, it contains many components. Choosing the right components is a design decision and is something you need to select based on the production environment in which your model will eventually run. Here is a sample of the metrics that can be showcased:
- Metrics about the training hardware system: Memory; CPU usage %; Disk IO reads
- Metrics about the training quality: Loss conversion; Validation metrics
In summary, with Deci’s new training visualization capabilities, you can see all of the training experiments that your team is running and their status in one dashboard and easily manage them. Using the insights from the visualizations, you can easily tweak the model.
Once training is done and you can compare the accuracy and runtime performance of your trained models and choose the best model and compile and quantize it to the inference hardware – all within the Deci platform.