Introduction
Quantization of large language models (LLMs) serves as a key strategy to reduce their size and memory usage, all the while striving to retain their quality. This compression technique is pivotal for deploying advanced models on devices with limited computational capabilities. Today, a variety of LLM quantization methods are employed, including Bitsnbytes, 4-bit GPTQ, 2-bit GPTQ, and GGUF quantization, each with its potential to impact model quality differently. Given the inherent risk of quality degradation during quantization, Deci’s Dev Rel, Harpreet Sahota, set out to compare these methods and evaluate their effect on model performance.
To that end, Harpreet quantized DeciLM-7B-instruct model using each of these quantization approaches, and then evaluated the quantized versions against several metrics. This blog aims to report his exploration and the consequential findings.For those interested in a more in-depth understanding of Harpreet’s analysis on LLM quantization methods and their impact on model quality, we encourage you to consult Harpreet’s Google Colab notebook, which offers a detailed walkthrough of the evaluation process. For an in-depth walkthrough of the notebook with Harpreet’s expert commentary, tune into our YouTube video.
LLM Quantization Methods
Quantization reduces the precision of the model’s parameters from floating-point representations to lower-bit representations. Common quantization approaches include Bitsnbytes, 4-bit GPTQ, 2-bit GPTQ, and GGUF quantization. Each method has its unique way of approximating the original model parameters, with the overarching goal of reducing model size and potentially speeding up computation. However, this approximation can lead to a degradation in model performance, which must be carefully evaluated.
Assessing the Impact of LLM Quantization on Model Quality
To analyze the influence of quantization on LLMs, Harpreet methodically employed a set of evaluation metrics—perplexity, BLEURT, ChrF, Frugalscore, and METEOR. Each metric served as a tool to compare and contrast the performance impacts attributed to various LLM quantization methods.
Perplexity
Perplexity is a commonly used metric for evaluating language models, and it’s basically a measure of the uncertainty of a probability model in predicting a sample.
Consider what we mean by “probability” in the context of a language model. When a language model predicts the next word in a sentence, it assigns a probability to each possible word in its vocabulary. And so, the canonical use of perplexity for evaluating the performance of a language model is quantifying how well the model can predict the next token in a sequence. The lower the perplexity, the better the model is at making predictions, indicating a lower level of uncertainty.
The Process of Calculating Perplexity
The calculation of perplexity involves the following series of steps:
- Concatenation and Tokenization: Initially, the entire validation dataset is merged into a single text block, using line breaks as separators. This concatenated text is then tokenized using the model’s specific tokenizer.
- Segmentation: The tokenized text is divided into segments that align with the model’s maximum token consideration capacity per prediction. For models like DeciLM-7B-Instruct, this capacity is typically 4096 tokens.
- Log-Probability Collection: Each segmented piece undergoes a forward pass through the model, generating probabilities for every potential subsequent token based on the context provided by preceding tokens.
- Perplexity Calculation: With the collected probabilities, perplexity is computed as the exponentiated negative average log probability of the sequence under the model. This calculation gives us a direct measure of the model’s predictive uncertainty.
Using Perplexity to Assess Quantization’s Impact on Model Quality
To use perplexity to assess the impact of LLM quantization on model quality, Harpreet used the metric in an unconventional way:
- Engage both quantized and unquantized versions in generating text from provided prompts.
- Calculate the perplexity of these completions, with the unquantized model’s completions taken as the ground truth.
- Divide the perplexity of the quantized model’s outputs by the perplexity of the unquantized model’s outputs. This gives a ratio that indicates the relative impact of quantization on the model’s language generation capabilities.
Note that when you calculate perplexity on text generated by the model itself, you are essentially trying to measure how well the model can predict the text it has just produced.
Issues with Using Perplexity in This Way
Using Perplexity in this unconventional way, with the model’s own generated text as the ground truth brings up several considerations:
- Lack of a True Distribution: Perplexity calculations assume a “true” distribution of words. When evaluating generated text, you don’t have this ground truth; you’re comparing the model to itself.
- Model Bias: The generated text reflects the model’s own biases and tendencies. Calculating perplexity on this text might show how consistent the model is with itself but not necessarily how well it understands or can predict real-world language usage.
- Practical Relevance: Since perplexity typically requires a reference distribution, using generated text to calculate perplexity is unconventional. It could indicate how coherent or predictable the model’s own generated text is according to its internal probabilities, but it doesn’t directly measure the model’s ability to deal with external, unseen data.
- Model Consistency: This method assumes that the unquantized model’s outputs are the desired standard of language generation. It’s important to consider whether the unquantized model itself generates high-quality, coherent text according to your criteria.
Advantages of this Use of Perplexity
Despite these issues, calculating perplexity on generated text could provide insights into the model’s internal consistency or the diversity of its outputs.
For example:
- Consistency: A lower perplexity might indicate that the generated text is very consistent with the patterns the model has learned, suggesting a sort of internal coherence.
- Diversity: Conversely, higher perplexity might suggest that the model is capable of generating more diverse or less predictable text, according to its own understanding of language.
The Results
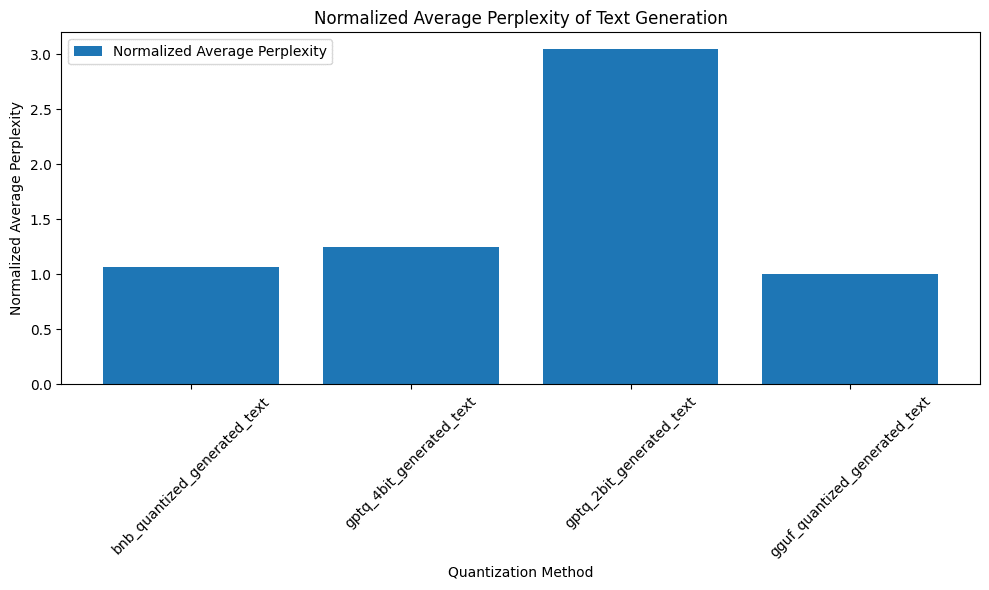
The analysis reveals that, on average, perplexity values across different LLM quantization methods did not significantly deviate from the unquantized model, suggesting that quantization, to some extent, maintains the model’s predictive capabilities. However, the 2-bit GPTQ quantization method exhibited notably higher perplexity, indicating a potential degradation in predictive performance.
BLEURT
BLEURT, a learned evaluation metric grounded in the BERT architecture, is designed to quantify the degree of similarity between a candidate sentence and a reference sentence.
By focusing on the semantic similarities between predicted text and reference material, BLEURT excels in evaluating the quality of text generated by models against a defined gold standard.
In the paper introducing the metric, BLEURT’s developers propose that this metric offers a closer correlation with human judgment compared to both BERT and BERTscore, making it a superior tool for assessing the nuanced aspects of text generation.
The Process of Calculating BLEURT
- BLEURT starts with a pre-trained BERT model
- The pre-trained BERT model is then further trained on synthetic and real data to predict scores aligning with human judgments.
- The synthetic data is generated by perturbing reference sentences in ways typical for machine-generated text (e.g., by dropping words or shuffling phrases).
- The real data consists of pairs of sentences and human ratings that indicate the quality of the machine-generated text compared to a reference.
- BLEURT is fine-tuned on a dataset with human ratings after training on synthetic and real data.
- For a given pair of references and generated text, BLEURT extracts features using its BERT-based architecture.
- Based on the extracted features, BLEURT computes a score that reflects the generated text’s quality compared to the reference text. This score is designed to correlate with human judgments, considering both the language’s content and quality.
BLEURT’s output is usually a number between 0 and (approximately 1). This value indicates how similar the generated text is to the reference texts, with values closer to 1 representing more similar texts.
Using BLEURT to Assess Quantization’s Impact on Model Quality
In assessing the impact of LLM quantization on model quality, BLEURT was strategically employed to measure the semantic similarity between texts generated by quantized models and their unquantized counterparts. By using the output from the unquantized model as the reference standard, BLEURT’s analysis provided insights into how closely the quantized models could replicate the semantic quality of the original text.
The Results
Quantized models varied in their ability to maintain semantic quality compared to the unquantized model. Some quantized versions closely matched the unquantized model’s output, indicating minimal loss in semantic integrity. However, others showed a noticeable decline, highlighting the challenges quantization can pose to maintaining text coherence and relevance.
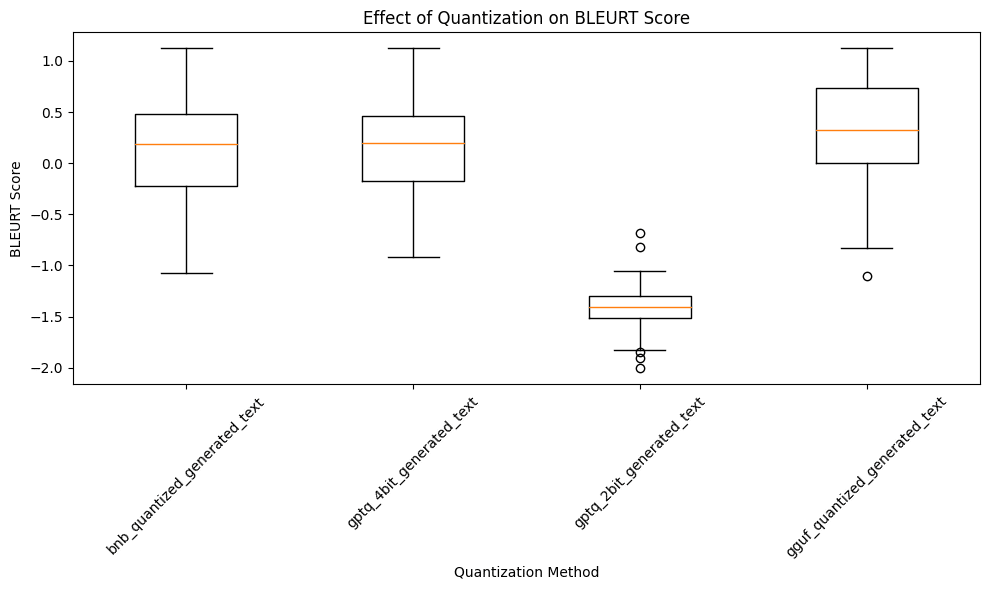
When benchmarked against the unquantized model’s output, three of the four LLM quantization methods—Bitsandbytes, GPTQ 4-bit, and GGUF—achieve a BLEURT score around 0.25. This score indicates a relatively low similarity between the quantized models’ outputs and that of the unquantized model, suggesting a notable impact on semantic integrity due to quantization. More strikingly, the GPTQ 2-bit method yields a negative BLEURT score. This result suggests a significant divergence from the unquantized model’s output, pointing to a substantial degradation in the quality and coherence of the text generated by this quantization approach.
ChrF
ChrF is an automatic evaluation metric used to assess the quality of text generation systems, especially for tasks like machine translation.
Here are some key points about ChrF:
- ChrF stands for “character n-gram F-score”. It calculates the precision and recall of character n-grams between the generated text and reference texts to produce an F-score.
- It was proposed by Popović (2015) as an alternative to metrics like BLEU that rely on exact word matches.
- As an F-score based metric, ChrF calculates precision and recall of character n-grams at different n-gram lengths (typically n=6 and n=9) and combines them into a single score.
The Process of Calculating ChrF
- Character n-grams: ChrF evaluates both the generated text and the reference text at the level of character n-grams. This involves looking at all sequences of n-grams in the texts. Common n-grams unigrams, bigrams, trigrams, etc., though the metric can consider a range of values.
- Precision and Recall: The metric calculates:
𝐹𝛽=(1+𝛽2)*(CHRP*CHRR)/(𝛽2*CHRP+CHRR)
- CHRP – Character Precision: The percentage of n-grams in the generated text actually appear in the reference text. Higher is better.
- CHRR – Character Recall: The percentage of n-grams in the reference text are actually present in the generated text. Higher is better.
- β is a parameter that assigns β times more importance to recall than to precision – if β = 1, they have the same importance.
- This score balances precision and recall, and provides a single measure of quality. The F-score is often weighted more towards recall to prioritize the completeness of the generated text over its succinctness.
Using ChrF to Assess Quantization’s Impact on Model Quality
To gauge quantization’s impact on model quality, Harpreet utilized the ChrF metric, focusing on character-level analysis between the generated text of quantized models and the reference text from the unquantized model.
The Results
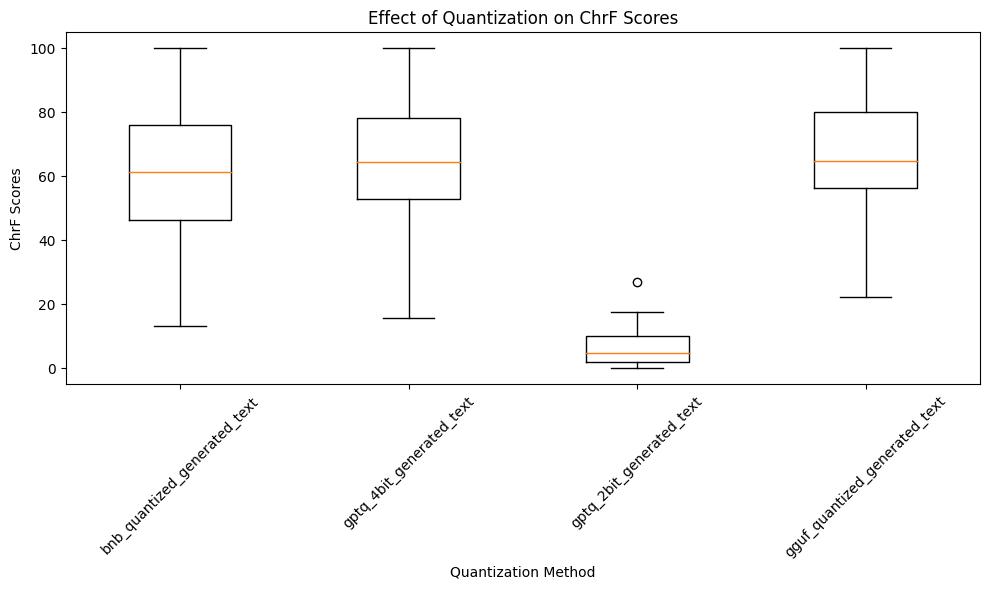
Image Source: Maxar Technologies Blog
In his analysis using the ChrF metric to assess LLM quantization’s impact, Harpeet found that models quantized with all methods, barring GPTQ 2-bit, achieved ChrF scores around 60%. This indicates a strong similarity to the unquantized model’s output and is considered a commendable score. In contrast, the GPTQ 2-bit quantization method significantly lowered the ChrF score, suggesting it adversely affects the model’s ability to maintain the original text’s character patterns and overall textual quality.
Frugalscore
Frugalscore is an evaluation metric that offers similar functionality to BLEURT but with a crucial advantage: speed. By utilizing a lightweight model, Frugalscore provides a rapid assessment of text quality, making it an ideal choice for environments with limited computational resources.
The Frugalscore metric can be calculated using either MoverScore or BertScore.
The Process of Calculating Frugalscore
- Text Preparation: Both the generated and the reference texts are tokenized.
- Embedding Extraction: Contextual embeddings are extracted using a pretrained language model for each token in both texts.
- Semantic Alignment: Computes the Earth Mover’s Distance (EMD) between the distributions of the embeddings from the generated text and the reference text. The EMD is a measure of the cost of transforming one distribution into the other, which, in this case, translates to the effort needed to semantically align the generated text with the reference text.
- Distance Calculation: The EMD calculation involves finding the optimal alignment of words or phrases between the two texts, minimizing the overall semantic distance.
- Score Computation: The EMD quantifies how much “work” it would take to move from the semantic space of the generated text to that of the reference text. The MoverScore metric translates this into a score that reflects the quality of the generated text relative to the reference. A lower EMD (and thus a higher MoverScore) indicates a closer match between the generated text and the reference, suggesting better performance of the text generation model.
Using Frugalscore to Assess Quantization’s Impact on Model Quality
HarpreetHa utilized Frugalscore with the MoverScore metric, comparing the semantic alignment of texts generated by quantized models to the unquantized model’s output.
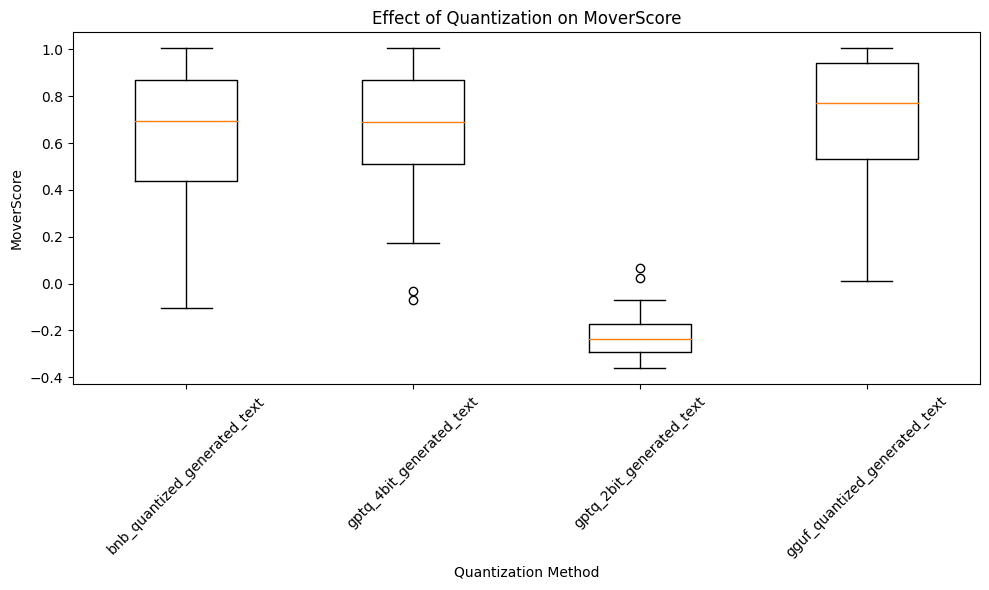
The Results
Three out of the four LLM quantization methods—Bitsandbytes, GPTQ 4-bit, and GGUF—achieved MoverScores ranging between 0.7 and 0.8. Such scores denote a high level of similarity to the unquantized model’s output, indicating minimal impact on the semantic quality through quantization. In contrast, the GPTQ 2-bit method registered a significantly lower MoverScore of 0.2, highlighting a marked reduction in textual quality and coherence, and underscoring a pronounced deviation from the semantic integrity of the unquantized model’s output.
METEOR
The METEOR score, Metric for Evaluation of Translation with Explicit Ordering, is an evaluation metric used in natural language processing to assess text quality generated by machine translation systems.
It focuses on precision and recall, considering synonymy and stemming, and provides a more balanced evaluation of translation quality or text generation.
- METEOR considers synonyms and stemming, which allows for a more flexible matching of words and a better understanding of meaning.
- Recall and Precision: METEOR provides a more balanced evaluation than metrics that consider only precision by considering both precision and recall.
- METEOR has been shown to have a higher correlation with human judgment than BLEU, making it a more reliable metric for evaluating translation quality.
The Process of Calculating METEOR
- First, align the words in the hypothesis and the reference text. This alignment is based on exact matches, stem matches, and synonym matches, with exact matches being preferred over stem matches and stem matches over synonyms.
- Calculate individual scores for precision and recall once the alignment is made.
- Precision is the number of matched words in the hypothesis divided by the total number of words.
- Recall is the number of matched words in the hypothesis divided by the total number of words in the reference.
- Compute the harmonic mean of the precision and recall scores, known as the F-score. The harmonic mean is used because it balances precision and recall, with a bias towards the lower of the two.
- Apply a penalty for poorly ordering the matched words. The penalty is based on the number of chunks of contiguous matched words in the hypothesis and the reference. More chunks mean more fragmentation, which leads to a higher penalty.
- The final METEOR score is computed by multiplying the F-score by a factor of (1 – penalty). The penalty factor typically reduces the score if the matched words are in a different order or are far apart in the hypothesis compared to the reference.
Using METEOR to Assess Quantization’s Impact on Model Quality
Harpreet compared the outputs from quantized models against the output of the unquantized model, using the latter as a benchmark for quality. This analysis allowed us to see how closely the quantized models’ text matched the unquantized model’s semantic richness and syntactic accuracy.
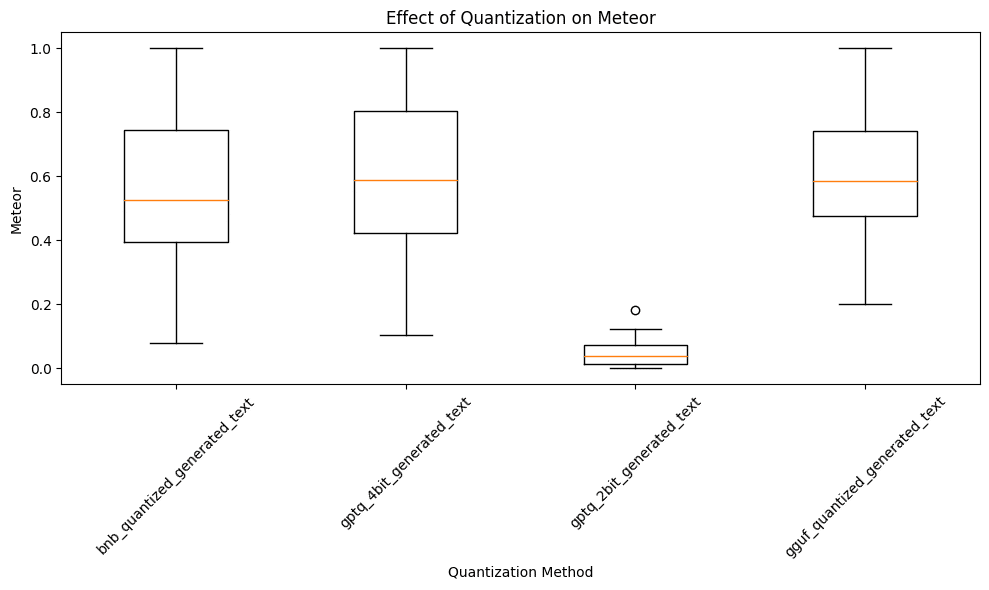
The Results
Three out of the four LLM quantization methods—excluding GPTQ-2bit—achieved respectable METEOR scores, using the unquantized model’s output as the reference standard. GPTQ-4bit and GGUF marginally outperformed Bitsandbytes quantization. Conversely, the METEOR score for GPTQ-2bit was close to zero, highlighting a significant quality drop and a clear departure from the standards set by the unquantized model.
Statistical Analysis of LLM Quantization Effects on Model Quality
To further analyze the above results and determine which LLM quantization method is least affected, consider conducting a Kruskal-Wallis H test. This non-parametric test compares the impacts of different quantization methods without assuming a normal data distribution. If significant differences emerge, follow up with post-hoc tests, such as Dunn’s test, to pinpoint specific contrasts between models. This statistical approach will clarify how LLM quantization affects each model, guiding towards the method that best preserves model quality.
Conclusion
Quantization is vital for deploying LLMs on resource-constrained devices by reducing their size and computational demands. This study evaluates the effects of various LLM quantization methods on model quality through metrics like perplexity, BLEURT, ChrF, Frugalscore, and METEOR. Findings reveal that while BitsandBytes, GPTQ 4-bit and GGUF methods preserve semantic quality, GPTQ 2-bit severely impacts text coherence. Thus, selecting the right quantization strategy is crucial for maintaining LLM effectiveness without sacrificing linguistic performance. This research aids in choosing quantization approaches that balance efficiency with quality preservation.
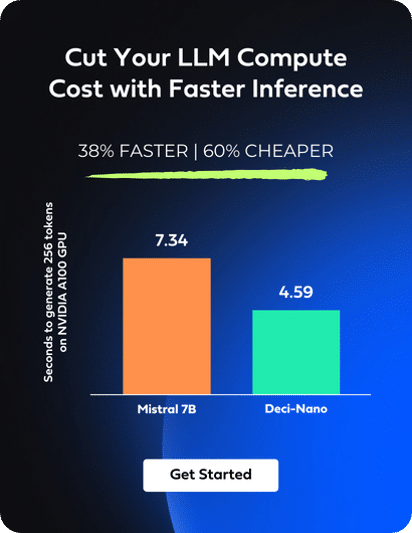
Optimizing the memory footprint of your LLM is crucial, and quantization offers a path to achieve this. However, for those aiming to deploy LLMs on devices with limited resources, the key lies in starting with an inherently efficient model. Such models strike an optimal balance between quality, size, and computational efficiency right from the outset, even before any quantization is applied. Deci’s suite of LLMs, including Deci-Nano, DeciLM-7B, DeciCoder-6B, and DeciCoder-1B, exemplifies this principle.
We invite you to explore the capabilities of Deci’s LLMs and our GenAI Development Platform. This platform is engineered to empower developers to deploy and scale high-performing models with unparalleled efficiency. It not only supports quantization but also offers the critical advantage of enabling on-premises deployment, ensuring your data stays secure and within your control.
If you’re interested in exploring our range of models, we invite you to sign up for a free trial of our API. For those curious about our VPC and on-premises deployment options, we encourage you to book a 1:1 session with our experts.