
Defining Color Distribution
Color Distribution compares RGB or grayscale intensity distributions across an entire dataset. It measures the intensity of each color channel (ranging from 0-255) across all images in the dataset.
The Importance of Color Distribution
Analyzing color distribution can reveal discrepancies in image characteristics between two datasets.
For instance, a notable difference in the mean value of a specific color between two datasets may indicate an issue with data consistency or the augmentation process.
Understanding the color distribution will help identify such potential issues early, ensuring the model is trained on a consistent and representative dataset.
Calculating Color Distribution
To calculate the color distribution, you iterate over all the images in your dataset. For each image, count the frequency of pixel intensities for each color channel (Red, Green, Blue, or Grayscale).
Do this separately for the training and validation sets. The result is a distribution of color intensities for each color channel, which compares the color characteristics of different datasets.
Here’s how Color Distribution is calculated in DataGradients.
Exploring Color Distribution Through A Problematic Example
Consider an example in which the color distribution graphs of the training and validation sets look like this:
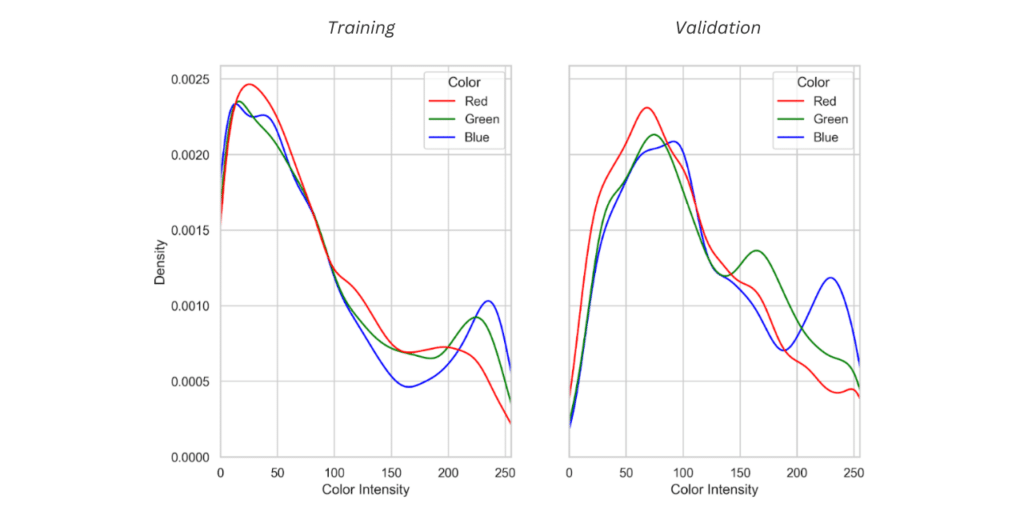
In the training dataset represented here, we can see that there’s a higher distribution of low-intensity colors (in the 0-100 range) and a lower distribution of higher-intensity colors (in the 100-250 range).
In the validation set, there’s a higher distribution of higher-intensity colors (in the 100-250 range). In other words, the mean intensity for at least one of the colors shifts to the right in the validation set.
The Underlying Problem
What might explain this discrepancy between the distribution of colors in the two sets?
The most plausible explanation is this:
- The data contains images of two (or more) types (e.g. images from different sources), but this data wasn’t distributed evenly between the two sets.
This may lead to poor performance by the model, so it’s an issue that needs to be addressed. In the next lesson, we will focus on data shuffling and redistribution – a technique that can address this problem.