
Defining Visualization of Semantic Segmentation Samples
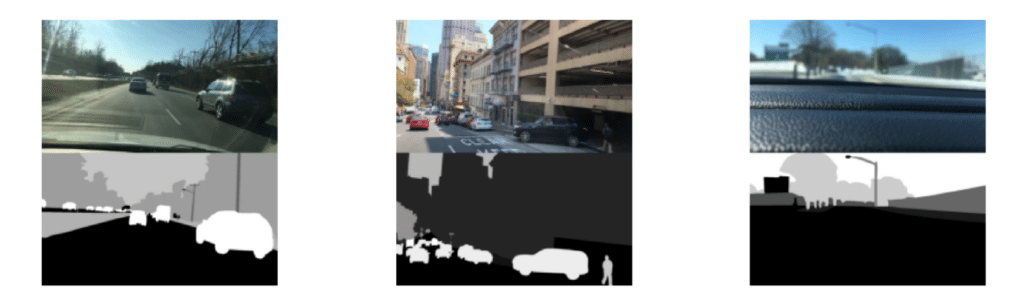
Visualization of Samples is qualitative technique that generates visual representations of images and their corresponding labels in the dataset.
It helps in understanding the composition of the dataset by displaying the original images along with their post segmentation versions.
The Importance of the Visualization of Semantic Segmentation Samples
Visualizing samples is essential for gaining insights into the properties and quality of a semantic segmentation dataset.
It allows you to observe how areas within an image are labeled, the size and shape of segmented regions, and the distribution of classes within images.
This process can help you detect potential issues like incorrectly labeled segments, regions of interest that are inaccurately delineated, or an imbalance among the classes present in the segmented regions.
Generating a Visualization of Semantic Segmentation Samples
The technique involves generating overlaying label color maps on the images.
Here’s how a visualization of semantic segmentation samples is generated in DataGradients.
Exploring Visualization of Semantic Segmentation Samples Through Examples
Visualizing samples of your semantic segmentation dataset can provide valuable insights into inaccuracies in the delineation of regions of interest. Let’s consider an example:
Suppose you’re training a model to identify different types of terrain in satellite imagery, such as forest, water, urban areas, and farmland. You visualize a sample image which shows a river flowing through a forested area.
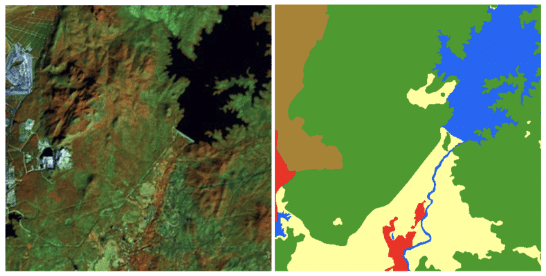
If your regions of interest have been accurately delineated, the boundary between the forest and the river should closely follow the actual transition between these two types of terrain in the image. The river should be entirely labeled as ‘water’, and the forest as ‘forest’, with a clear boundary between them.
However, suppose instead that you notice a significant part of the river is labeled as ‘forest’. The boundary between the river and the forest in your segmentation doesn’t match the actual transition between these two types of terrain in the image. This would indicate that the region of interest ‘water’ has been inaccurately delineated, encompassing less area than it should, and that the ‘forest’ region has been overextended.
In another instance, perhaps the delineation is too coarse or too smooth, not capturing the meandering shape of the river, but instead labeling it as a straight or simply curved line. This would be another example of an inaccurately delineated region of interest.
These inaccuracies could impact the performance of your model, as it might learn to incorrectly identify and delineate similar regions in other images. Visualizing samples thus helps uncover these issues, allowing you to correct your labels and improve the quality of your dataset.