Defining Distribution of Object Width and Height
Distribution of Object Width and Height refers to the dataset’s distribution of objects’ dimensions per class. It is represented by a heat map.
The heat map visualizes how object sizes vary across different classes. This feature is analogous to Distribution of Bounding Box Width and Height for object detection datasets.
The Importance of the Distribution of Object Width and Height
Large variations in object size can impact a model’s ability to recognize objects accurately.
Understanding the distribution of object widths and heights per class helps identify potential challenges related to object scale and proportion.
It provides insights into whether certain classes have consistent sizes or exhibit significant variations in size.
Calculating Distribution of Object Width and Height
The feature calculates the width and height of each object’s bounding box as a percentage of the total image width and height, respectively.
The measurements are obtained by analyzing each class’s contours of segmented regions. The resulting width and height percentages are then aggregated and visualized using heat maps.
The heat maps highlight areas of concentration or dispersion in object sizes for each class.
Here’s how Distribution of Object Width and Height is calculated in DataGradients.
Exploring Distribution of Object Width and Height Through Examples
Let’s look at two examples and consider what we can learn about our datasets from an analysis of Distribution of Object Width and Height.
Example 1: A Favorable Scenario
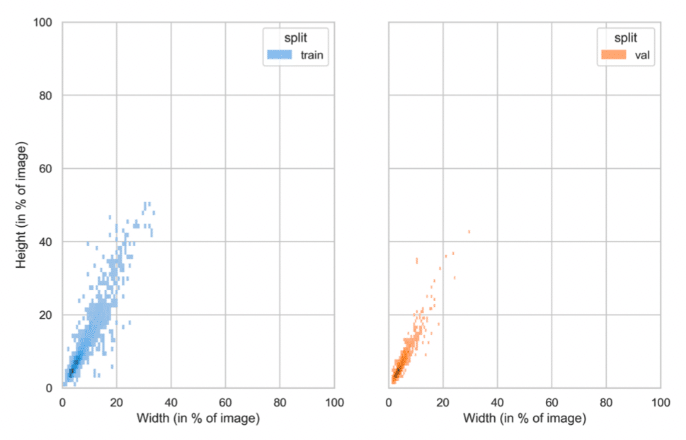
In this example, we do see a difference in the distribution of object width and height between the two sets for a particular class. However, the validation set falls within the training set. Therefore, a model trained on that data will be better able to generalize object size for this class than if it were directly trained on a distribution similar to the validation. It will be more robust to changes in object size when moving to production.
Example 2: A Problematic Scenario
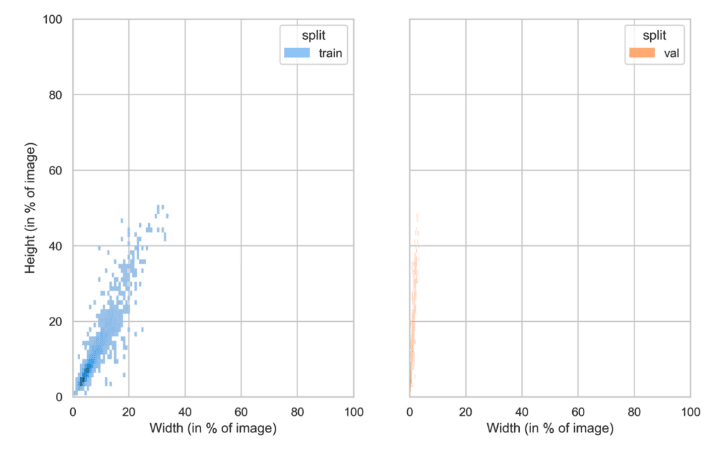
In this instance, there’s a significant difference between the training and validation distributions concerning the width of the objects. This discrepancy can lead to potential issues. A model trained on this data is predisposed to overfit to objects of specific sizes observed in the training set. Consequently, its performance on the validation set, which contains objects of varying sizes, might be suboptimal.