
Defining Distribution of Bounding Box Width and Height
Distribution of Bounding Box Width and Height refers to the distribution of the sizes of bounding boxes in the dataset, categorized by class.
It is represented as heat maps that illustrate each class’s bounding box width and height distribution.
The Importance of the Distribution of Bounding Box Width and Height
It is important to know the sizes of bounding boxes for accurate object recognition.
If there are significant differences in the sizes of objects, the model may struggle to identify smaller objects or accurately recognize larger ones.
This information can help adjust the model’s parameters or preprocessing steps to improve performance.
Calculating Distribution of Bounding Box Width and Height
To calculate the bounding box width and height distribution, iterate over all the bounding boxes in your dataset.
Calculate each bounding box’s width and height as a percentage of the image’s width and height, respectively. Do this separately for each class and the training and validation sets.
The result is a heat map that shows the distribution of bounding box sizes for each class.
Here’s how Distribution of Bounding Box Width and Height is calculated in DataGradients.
Exploring Bounding Box Width and Height Through Examples
Let’s look at two examples and consider what we can learn about our datasets from an analysis of the Distribution of Bounding Box Width and Height.
Example 1: A Favorable Scenario
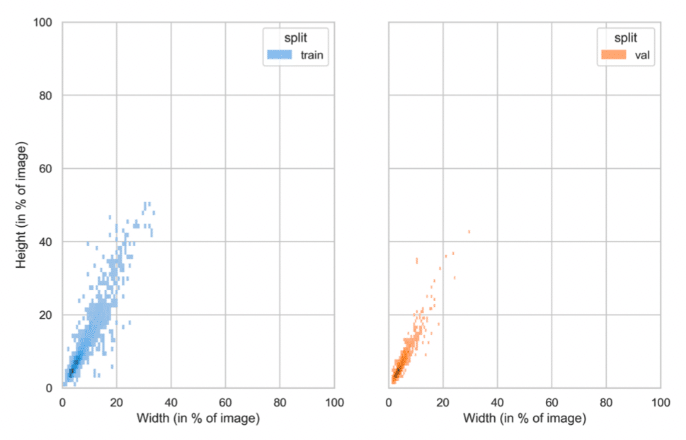
In this example, we observe a discrepancy in the bounding box width and height distribution between the two sets for a specific class. However, the validation set’s distribution lies within the range of the training set’s distribution. Consequently, a model trained on such data would be more adept at generalizing the object size for this class, compared to a model trained on a distribution mirroring that of the validation set. In terms of deployment, such a model would display greater robustness to variations in object size when transitioning into production.
Example 2: A Problematic Scenario
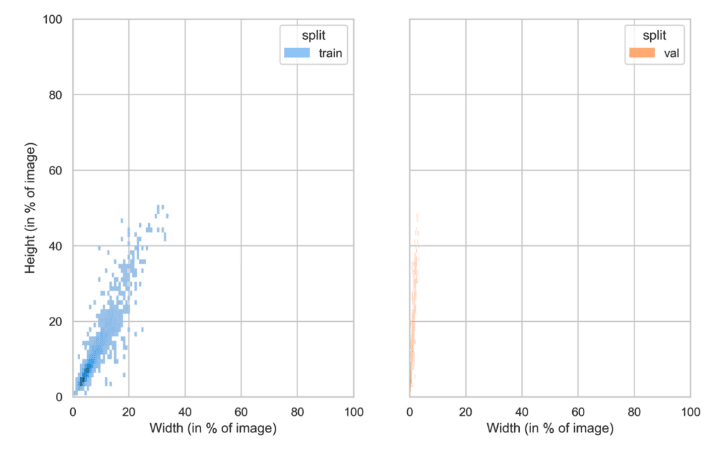
In this case, there is a substantial discrepancy between the training and validation distributions with respect to width.
This could lead to challenges, as a model trained on this data might be prone to overfitting to objects of a specific size and subsequently perform less optimally on the validation set.