
Defining Visualization of Object Detection Samples
This technique provides a straightforward yet insightful perspective by displaying your images alongside their bounding boxes and class labels. Simple on the surface, yet it might surprise you with the depth of understanding it brings. Remember, often the most straightforward tools, like this one, offer us some of the most significant insights.
The Importance of the Visualization of Object Detection Samples
Visualizing samples is important for understanding the quality and characteristics of the dataset.
It allows you to see how objects are labeled, the size and position of bounding boxes, and the distribution of objects within images.
This can help identify potential issues such as mislabeled data, poorly positioned bounding boxes, or class imbalance.
Generating a Visualization of Object Detection Samples
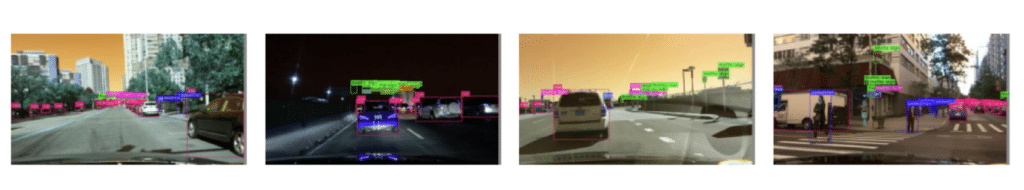
Overlay the appropriate bounding boxes and class labels on the images.
The bounding boxes are drawn based on the coordinates provided in the dataset, and the corresponding class labels are placed at the top-left corner of each bounding box.
Here’s how a visualization of object detection samples is generated in DataGradients.
Exploring Visualization of Object Detection Samples Through an Example
Let’s consider the task of detecting different blood components – white blood cells, red blood cells, and platelets – in microscope images, a common use case in automated blood smear analysis.
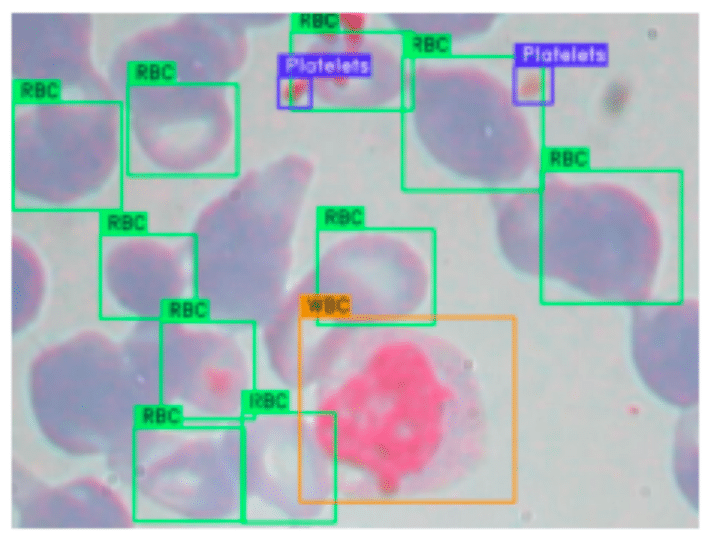
In an ideal scenario, as demonstrated in one of our samples, each labeled object is well-placed within its bounding box, accurately reflecting the actual object location in the image. Each white blood cell, red blood cell, and platelet is approximately centered in its bounding box and comfortably contained within its boundaries. This precise alignment indicates a quality dataset where transformations applied to the image have been accurately reflected in the bounding box coordinates. Consequently, a model trained on such data is more likely to correctly associate the bounding box areas with the respective cell types, enhancing its predictive performance on unseen data.
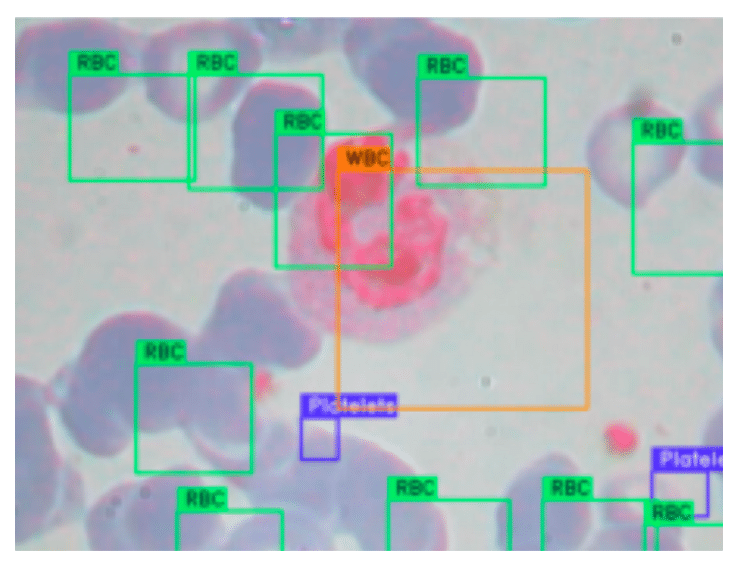
However, not all samples may be as ideally annotated. For instance, another sample from the same dataset reveals a consistent shift of all bounding boxes towards the bottom-right corner of the image. Such a uniform shift is unlikely coincidental and suggests an improper application of transformations to the image and its bounding boxes. A possible scenario could be cropping or repositioning of the image without appropriately adjusting the bounding box coordinates. This can mislead the model during training, as the bounding boxes no longer accurately represent the location of the objects of interest. Consequently, the model’s ability to accurately detect blood cells and platelets in new images could be compromised.
The disparity between these examples underscores the importance of sample visualization in assessing the quality and accuracy of object detection datasets before proceeding with model training.