
Defining Distribution of Class Frequency per Image
The Distribution of Class Frequency per Image quantifies the occurrence count of each class within each image in a dataset.
This metric illuminates the class variability across different images, revealing the frequency and dispersion of different classes throughout the dataset. By examining this distribution, we can better understand how uniformly classes are represented across images.
The Importance of the Distribution of Class Frequency per Image
This metric is important because it can highlight whether each class has a constant number of appearances per image or whether it varies from one image to another.
This information can help understand your dataset’s diversity and representation of classes.
It can also indicate differences between the distribution of class frequencies per image between the training and validation set, which can lead to poor model performance.
Calculating Distribution of Class Frequency per Image
For each image in the dataset, the number of instances of each class is counted.
These counts are then aggregated across the dataset to create a distribution of class frequencies per image.
Here’s how Class Frequency per Image is calculated in DataGradients.
Exploring Distribution of Class Frequency per Image Through Examples
Let’s take a look at two scenarios: one where the dataset’s class frequency distribution doesn’t indicate any problems, and another where it highlights potential issues with the dataset.
Example 1: A Favorable Scenario
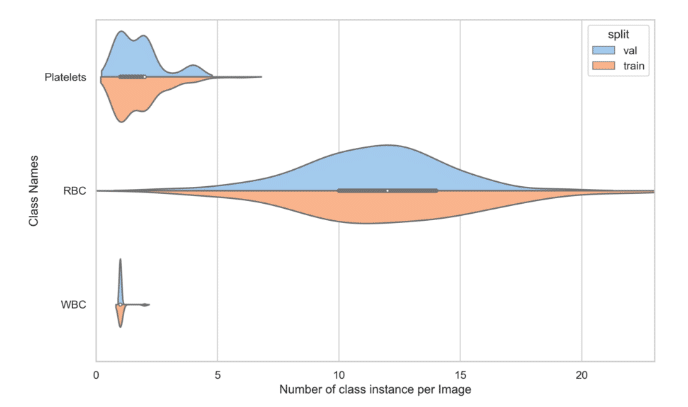
Here the distribution of class frequency per image is relatively similar across the validation set and training set. In both sets, the frequency of Platelets ranges from 0 to 5; the RBC frequency ranges from 2 to 20, with the average being around 12; and the WBC frequency is around 1.
Example 2: A Potential Issue
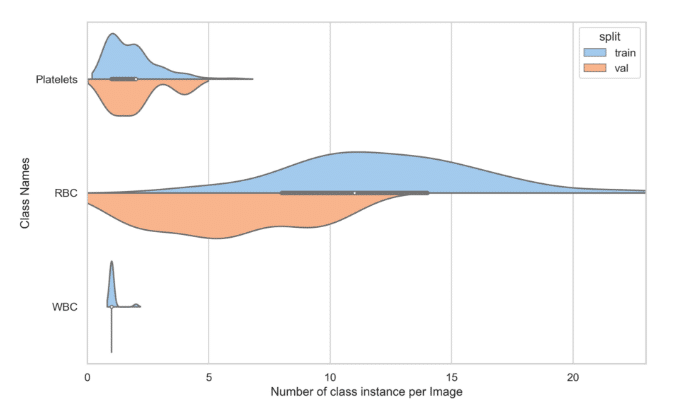
In this case, the distribution of RBC frequency in the training set ranges from 0 to 20, with an average of around 12. But in the validation set, that distribution ranges from 0 to 12, with an average of around 5.
The observed discrepancy could potentially stem from an issue with downsampling. For instance, if the Red Blood Cell (RBC) objects are minuscule, downsampling the image to a smaller resolution might cause the small bounding boxes (smaller than 1px after transformation) to be omitted. It’s plausible that the validation images originally had a higher scale and that many RBC objects were lost when the validation set was downscaled to match the scale of the training set images.
How to mitigate these issues?
- Re-compute Without Resizing: Recalculate this feature without applying any resizing transformations. This step will help you identify whether the issue arises from the original data, the downsampling process, or cropping.
- Consider Scale: Ensure that you are not downsampling the validation set to an excessively small scale that might compromise smaller objects within the image.