
Defining Intersection of Bounding Boxes
Intersection of Bounding Boxes refers to the distribution of the Intersection over Union (IoU) of bounding boxes within each class in the dataset.
The IoU is a measure of the overlap between two bounding boxes. It is calculated as the area of intersection divided by the area of union of the two boxes.
The Importance of the Intersection of Bounding Boxes
Analyzing the distribution of bounding box IoU helps highlight any discrepancies in object overlap between the training and validation splits, which can impact the model’s performance.
It’s particularly useful for object detection, where understanding the degree of overlap between objects can influence how you train and evaluate your model.
Calculating the Intersection of Bounding Boxes
To calculate the distribution of bounding box IoU, iterate over all the images in your dataset.
If you’re interested in seeing overlap only within classes, then for each image calculate the IoU for each pair of bounding boxes of the same class.
If you’re interested in seeing overlap with any other bounding box, regardless of class, then for each image, calculate the IoU for each pair of bounding boxes.
This is done by dividing the area of intersection of the two boxes by the area of their union.
The result is either a distribution of IoU values per class or a distribution of IoU values for all bounding boxes, which allows you to compare different datasets’ overlap characteristics.
Here’s how Intersection of Bounding Box Area is calculated in DataGradients.
Exploring Intersection of Bounding Box Area Through Examples
To understand how Intersection of Bounding Boxes can shape model training, let’s turn our attention to a couple of examples.
Example 1: A Favorable Case
Consider the following heatmap that represents the Intersection of Bounding Boxes (IoU) for a particular training set:
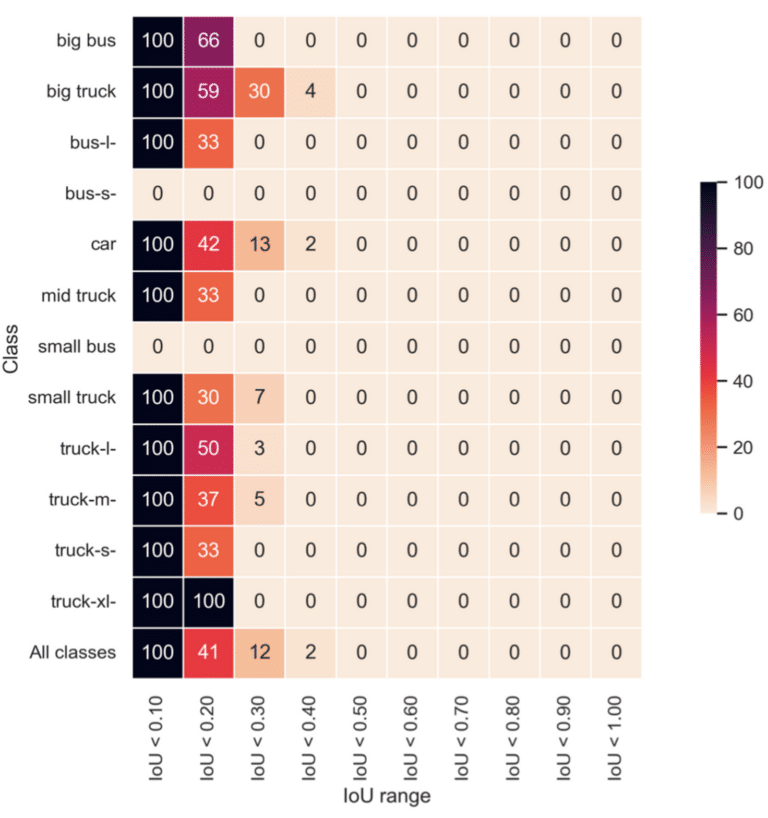
Here, we observe a certain degree of overlap in bounding boxes across most classes. However, the IoU seldom surpasses 0.40 and usually stays within the 0.30 range.
Having a comprehensive understanding of your dataset’s IoU distribution is pivotal for defining the threshold IoU value. This is a crucial parameter when employing Non-Max-Suppression (NMS) in your model.
NMS is a technique used in object detection to resolve the issue of multiple bounding boxes being detected around a single object.
NMS handles this problem by first sorting all the prediction boxes on the basis of their scores. The prediction box with the highest score is selected, and all other boxes with significant overlap (an IoU value above a certain threshold) with this box are suppressed, i.e., removed. This process is iteratively performed until all prediction boxes have either been selected or suppressed, hence the name “non-maximum suppression”.
The end result is that each object is detected and outlined once, typically by the bounding box that was predicted with the most confidence.
The choice of the IoU threshold is heavily influenced by your dataset, specifically by your dataset’s IoU distribution. In our example, an appropriate IoU threshold would be 0.3.
We’ll discuss NMS in greater detail in Lesson 5.5.
Example 2: A Problematic Case
Now, let’s analyze a different dataset represented by the following Intersection of Bounding Boxes heatmap:
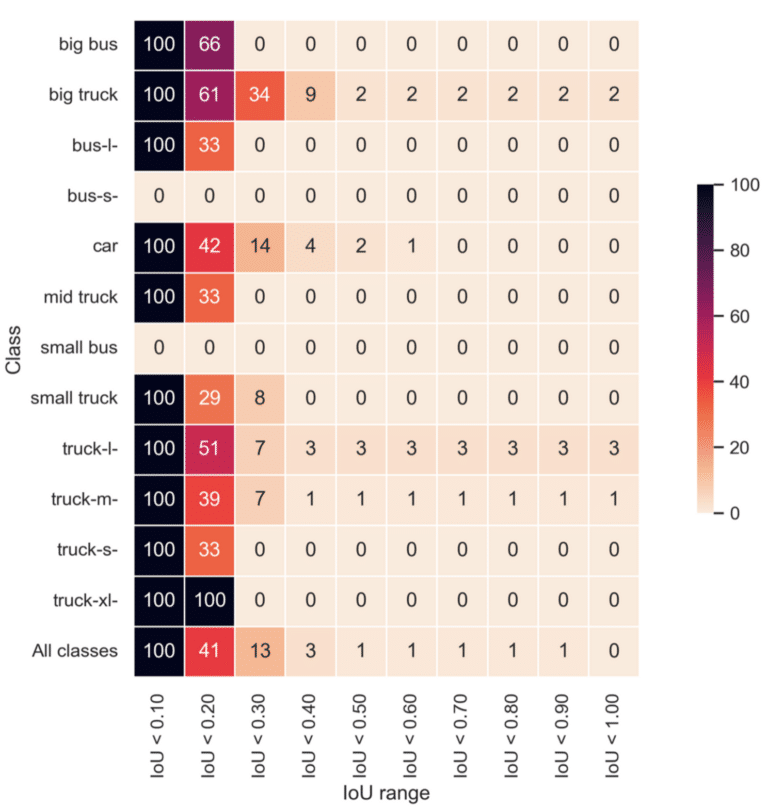
The heatmap reveals some intriguing facts about our dataset. Around 2% of ‘big truck’ and 3% of ‘truck-l’ class objects have an IoU of 1.0. This means that their bounding boxes completely overlap with another object of the same class. While less than 0.3 IoU accounts for around 97% of the ‘truck-l’ overlap, the remaining 3% exhibits a full overlap with an IoU of 1. This points to duplicate bounding boxes superimposed on each other.
This anomaly suggests a labeling issue with the dataset. This could be due to to images being labeled twice.