
Defining Distribution of Object Area
Distribution of Object Areas refers to the distribution of the area of objects (as represented by bounding boxes) for each class in the dataset. The area is expressed as a percentage of the total image area.
This feature is exactly analogous to the distribution of bounding box area for object detection datasets.
The Importance of the Distribution of Object Area
It is essential to consider the size of objects when training a model.
Measuring the bounding box area as a percentage of the whole image can help compare and visualize object sizes across different classes and data sets. If there are many small objects, the original images need to be downscaled more.
It is crucial to ensure no large difference in object sizes between the training and validation sets, as this could affect the model’s performance.
Calculating Distribution of Object Area
The bounding boxes are derived from each class’s contours of the segmented regions.
For each object in the dataset, the area of these bounding boxes is then calculated and expressed as a percentage of the total image area. This is done for each class separately.
The results are then aggregated and visualized using a violin plot, which shows the distribution of object areas for each class.
Here’s how Distribution of Object Area is calculated in DataGradients.
Exploring Object Area Distribution: Examples
An examination of the distribution of object area within our dataset can offer valuable insights. Let’s delve into this by considering two examples:
Example 1: A Favorable Scenario
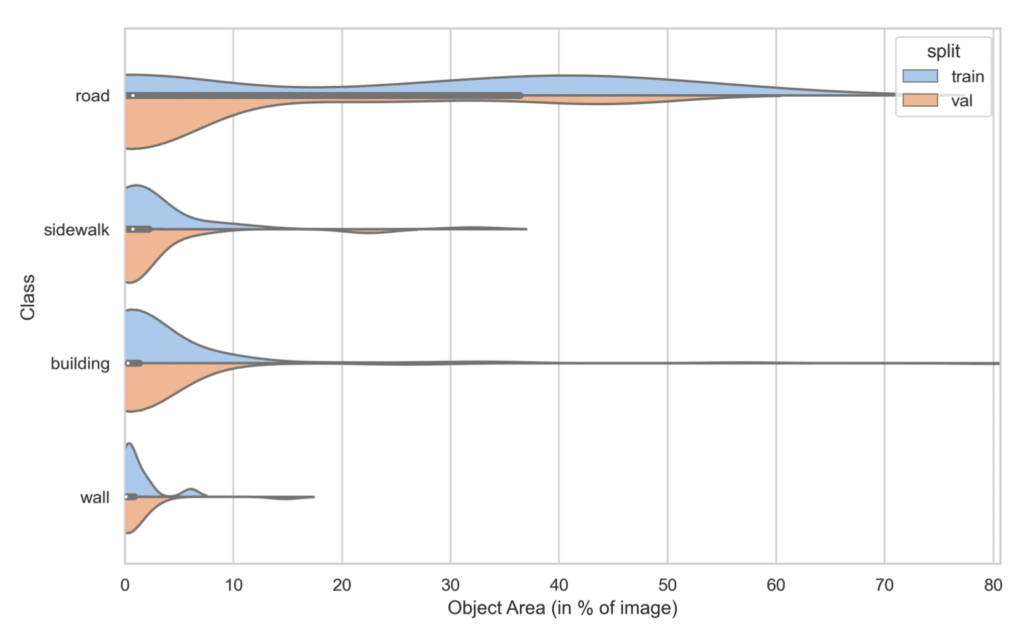
In this case, we observe closely aligned object area distributions for each class in the training and validation sets.
Example 2: A Problematic Case
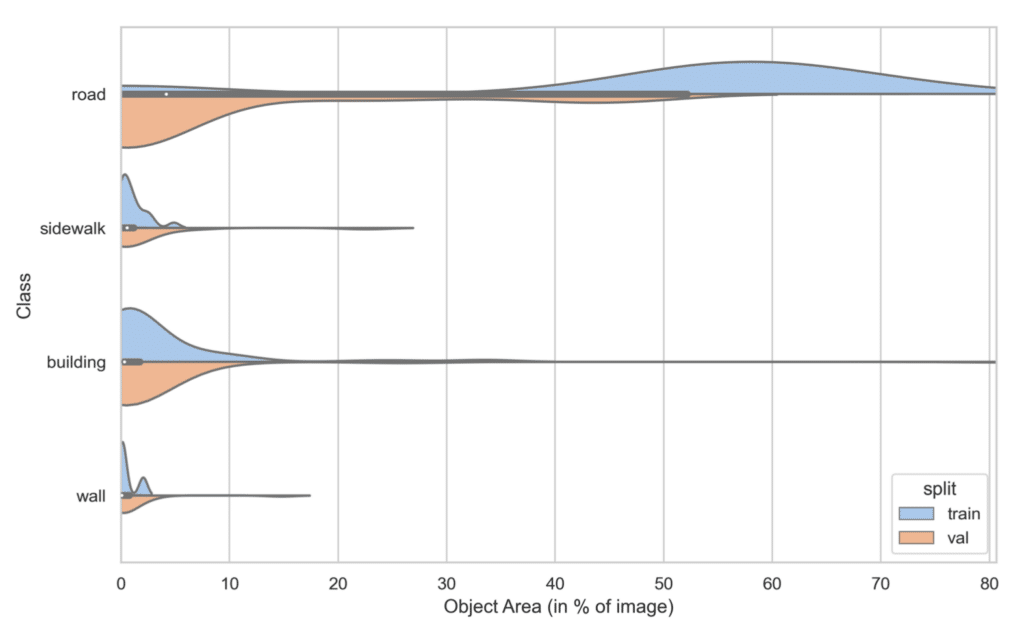
In contrast, here we see a situation where the road covers a significantly larger portion of the image in the training set compared to the validation set. The disparity is so stark that it necessitates investigation before initiating any training.
This discrepancy could stem from a substantial variation in the content of the images in each set. Alternatively, it could be the result of an aggressive data augmentation process that excessively crops or selects areas dominated by roads, such as center-cropping if roads centrally dominate the images.