
Defining Object Density
This feature provides heat maps that represent the density of objects within images.
The heat maps offer insights into the spatial distribution of objects, allowing you to identify areas of high object density versus areas with fewer objects.
Examining the heat map, you can assess if objects are predominantly concentrated in specific regions or evenly distributed throughout the scene.
The Importance of Object Density
Understanding the density of objects within an image helps assess how objects are spatially positioned.
It provides insights into whether objects are appropriately located within the expected areas of interest.
Examining the object density can also help identify potential biases or anomalies in the data, such as overcrowded or sparse regions. This can be crucial for model design, as will be discussed in Lesson 5.3.
Calculating Object Density
Object density is calculated on a per-class basis by taking each image in the dataset and creating its segmentation mask (an image where each pixel is labeled with the class it belongs to). These masks are resized and then accumulated to create heat maps representing objects’ density for each class.
Here’s how Object Density is calculated in DataGradients.
Exploring Object Density with Examples
Let’s look at two examples and consider what we can learn about our datasets from an analysis of Object Density. The dataset in both examples is composed of images of city streets.
Example 1: A Favorable Scenario

The sky is primarily located at the top of the image, which aligns with our expectations given that our dataset comprises images of city streets.
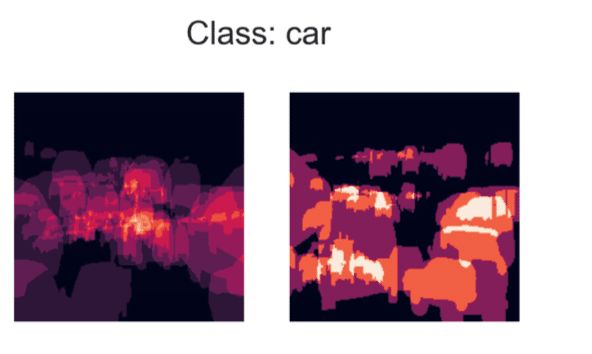
Reviewing the object density heatmaps for the class ‘cars,’ we discern some car shapes, with a slight increase in density around the center of the images. This distribution is consistent with what we’d anticipate given the nature of our dataset.
Example 2: A Problematic Case
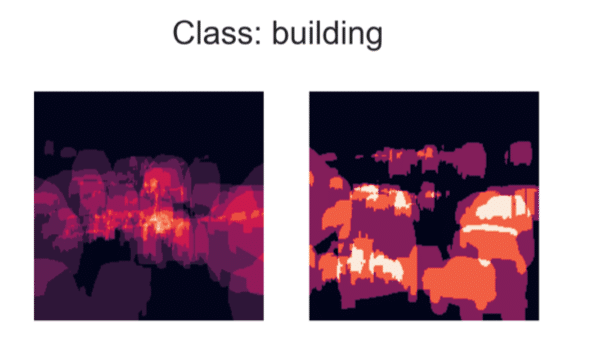
First, let’s analyze these heatmaps for the class ‘building.’ Surprisingly, we see clear car shapes in regions where we’d typically expect to spot cars. This indicates a potential mislabeling issue, with cars incorrectly labeled as buildings.
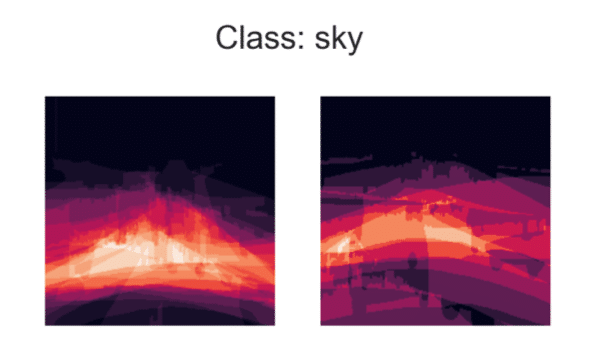
Next, consider these heatmaps for the class ‘sky.’ Given that our dataset comprises street images, it would be highly unusual for the sky to be predominantly in the center of the image. This inconsistency strongly suggests a possible labeling error.